
Welcome Back: in our first episode, we looked closely at Iraq’s economic Journey, exploring how employment share was distributed across different sectors (Figure 1) and the changing landscape of business sizes (Figure 2) from 2011 to 2022. Now we start another episode; it is like opening another fascinating book. This time, we are delving into the details that make Iraq’s economic story even more intriguing. We are talking about who is steering the ship at the top, how employment looks in various parts of the country, and the types of businesses making their mark. This episode will uncover the gender dynamics of top managers, the employment scene in various locations, and the varied landscape of companies- whether they are exporting or locally owned. So, please take your seat for the next chapter; it’s time to unravel more layers of Iraq’s economic story!
Figure 3: Number of firms by Top Managers’ Gender:
Source: Author’s computation data from World Bank
Figure 3 reveals the distribution of firms in Iraq based on the gender of top managers for 2011 and 2022. In 2011, (1.4%) of firms had a female top manager, while (98.3%) had a male top manager, and (0.3%) had a top manager with an unknown gender. By 2022, there was a marginal decrease in the percentage of firms with a female top manager (1.3%), accompanied by a slight increase in firms with a male top manager (98,7%). The total number of firms has increased from 746 to 975. These findings reveal a persistent gender disparity in top management positions, with most firms in both periods having male top managers. The marginal shift between 2011 and 2022 suggests some changes in gender representation within the firms but highlights the ongoing need for efforts to address gender imbalances in leadership roles.
Figure 4: Employment Share across Locations in Iraq
Source: Author’s computation data from World Bank
Figure 4 illustrates the employment share changes across various Iraq locations between 2011 and 2022. Erbil, which had a substantial 37.3% employment share in 2011, experienced a significant decline in 2022—a decrease in employment share in Sulaymaniyah. The data reveals the importance of examining localised trends to gain insights into the evolving economic patterns and employment dynamics within specific regions of the country. Even though the employment share decreased in some areas like Erbil and Sulaymaniyah, more firms added jobs in these regions. Moreover, in Baghdad, only 5.6% of jobs were added, which we will discuss in future episodes.
Figure 5: Exporter Type in Iraq:
Source: Author’s computation data from World Bank
Figure 5 reveals that in 2011, most businesses were non-exporters, constituting 99.4% of the total, with only a tiny percentage (0.6%) having direct exports accounting for 10% or more. By 2022. there has been a notable shift, with an increase in the proportion of businesses engaged in direct exports (4.9%). However, the majority (90.6%) still fall under the non-exporters category, while 4.5% have an unknown exporter type. It can be observed that there is a presence of exporter type unknown category in 2022, which highlights the potential gaps in the data collection or reporting mechanisms. Understanding these trends is crucial for policymakers and businesses to adapt strategies that align with the evolving dynamics of international trade.
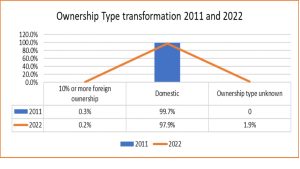
Figure 6: Overall Ownership Structure:
Source: Author’s computation data from World Bank
Figure 6 reveals the overall ownership structure in Iraq. In 2011, many businesses were domestically owned, accounting for 99.7%. A small percentage (0.3%) had 10% or more foreign ownership. By 2022, domestic ownership remains high at 97.9%, but there is a slight decrease. The percentage of businesses with 10% or more foreign ownership also decreased to 0.2%. Notable, there is now an additional ownership type unknown category, representing 1.9% of businesses. The provided data offers insights into the ownership structure of business in Iraq. While the information provides a snapshot of the ownership landscape, some critical considerations exist. Firstly, the granularity of the data is limited, particularly regarding the category of “10% or more foreign ownership.” without further details, it is challenging to discern the extent and impact of foreign investment. Additionally, introducing the “ownership unknown” category in 2022 raises questions about data accuracy and completeness.
As we conclude this exploration into the intricacies of Iraq’s economic landscape, stay tuned for the next episode, where we delve deeper into the dynamics of job creation and reduction within different sectors, locations, and ownership structures. Unveiling the percentage of firms that added jobs, those that experienced a decrease, and the resultant net employment share will provide a more comprehensive understanding of the evolving employment trends in the country. Stay engaged in the upcoming instalment of Iraq’s economic trajectory. Your journey into exploring data-driven narratives continues in the next episode- do not miss the unfolding story of Iraq’s economic landscape!
To be Continued.
Dr. Sultana Begum,
Department of Business and Management,
Faculty of Administrative Sciences and Economics,
Tishk International University, Erbil, Kurdistan Region of Iraq.
Figures of Last Episode:
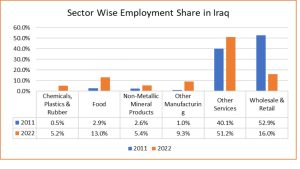
Figure 1: Sector-wise Employment Share in Iraq
Source: Author’s computation data from World Bank
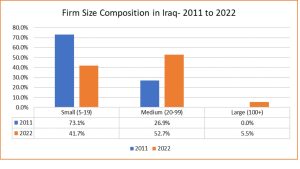
Figure 2:Firm Size Composition in Iraq
Source: Author’s computation data from World Bank
Welcome Back: in our first episode, we looked closely at Iraq’s economic Journey, exploring how employment share was distributed across different sectors (Figure 1) and the changing landscape of business sizes (Figure 2) from 2011 to 2022. Now we start another episode; it is like opening another fascinating book. This time, we are delving into the details that make Iraq’s economic story even more intriguing. We are talking about who is steering the ship at the top, how employment looks in various parts of the country, and the types of businesses making their mark. This episode will uncover the gender dynamics of top managers, the employment scene in various locations, and the varied landscape of companies- whether they are exporting or locally owned. So, please take your seat for the next chapter; it’s time to unravel more layers of Iraq’s economic story!
Figure 3: Number of firms by Top Managers’ Gender:
Source: Author’s computation data from World Bank
Figure 3 reveals the distribution of firms in Iraq based on the gender of top managers for 2011 and 2022. In 2011, (1.4%) of firms had a female top manager, while (98.3%) had a male top manager, and (0.3%) had a top manager with an unknown gender. By 2022, there was a marginal decrease in the percentage of firms with a female top manager (1.3%), accompanied by a slight increase in firms with a male top manager (98,7%). The total number of firms has increased from 746 to 975. These findings reveal a persistent gender disparity in top management positions, with most firms in both periods having male top managers. The marginal shift between 2011 and 2022 suggests some changes in gender representation within the firms but highlights the ongoing need for efforts to address gender imbalances in leadership roles.
Figure 4: Employment Share across Locations in Iraq
Source: Author’s computation data from World Bank
Figure 4 illustrates the employment share changes across various Iraq locations between 2011 and 2022. Erbil, which had a substantial 37.3% employment share in 2011, experienced a significant decline in 2022—a decrease in employment share in Sulaymaniyah. The data reveals the importance of examining localised trends to gain insights into the evolving economic patterns and employment dynamics within specific regions of the country. Even though the employment share decreased in some areas like Erbil and Sulaymaniyah, more firms added jobs in these regions. Moreover, in Baghdad, only 5.6% of jobs were added, which we will discuss in future episodes.
Figure 5: Exporter Type in Iraq:
Source: Author’s computation data from World Bank
Figure 5 reveals that in 2011, most businesses were non-exporters, constituting 99.4% of the total, with only a tiny percentage (0.6%) having direct exports accounting for 10% or more. By 2022. there has been a notable shift, with an increase in the proportion of businesses engaged in direct exports (4.9%). However, the majority (90.6%) still fall under the non-exporters category, while 4.5% have an unknown exporter type. It can be observed that there is a presence of exporter type unknown category in 2022, which highlights the potential gaps in the data collection or reporting mechanisms. Understanding these trends is crucial for policymakers and businesses to adapt strategies that align with the evolving dynamics of international trade.
Figure 6: Overall Ownership Structure:
Source: Author’s computation data from World Bank
Figure 6 reveals the overall ownership structure in Iraq. In 2011, many businesses were domestically owned, accounting for 99.7%. A small percentage (0.3%) had 10% or more foreign ownership. By 2022, domestic ownership remains high at 97.9%, but there is a slight decrease. The percentage of businesses with 10% or more foreign ownership also decreased to 0.2%. Notable, there is now an additional ownership type unknown category, representing 1.9% of businesses. The provided data offers insights into the ownership structure of business in Iraq. While the information provides a snapshot of the ownership landscape, some critical considerations exist. Firstly, the granularity of the data is limited, particularly regarding the category of “10% or more foreign ownership.” without further details, it is challenging to discern the extent and impact of foreign investment. Additionally, introducing the “ownership unknown” category in 2022 raises questions about data accuracy and completeness.
As we conclude this exploration into the intricacies of Iraq’s economic landscape, stay tuned for the next episode, where we delve deeper into the dynamics of job creation and reduction within different sectors, locations, and ownership structures. Unveiling the percentage of firms that added jobs, those that experienced a decrease, and the resultant net employment share will provide a more comprehensive understanding of the evolving employment trends in the country. Stay engaged in the upcoming instalment of Iraq’s economic trajectory. Your journey into exploring data-driven narratives continues in the next episode- do not miss the unfolding story of Iraq’s economic landscape!
To be Continued.
Dr. Sultana Begum,
Department of Business and Management,
Faculty of Administrative Sciences and Economics,
Tishk International University, Erbil, Kurdistan Region of Iraq.
Figures of Last Episode:
Figure 1: Sector-wise Employment Share in Iraq
Source: Author’s computation data from World Bank
Figure 2:Firm Size Composition in Iraq
Source: Author’s computation data from World Bank