

Dr. Sultana Begum
Assistant Lecturer
Department of Business and Management Lecturer
TIU – Erbil
Dr. Sultana Begum
Business and Management Lecturer
Transformation and Dynamics in Iraq’s Employment Market
A Decade of Employment Trends (2011-2022)
EPISODE -3
In the previous episodes, we set the stage for a deeper examination of Iraq’s employment dynamics. Now we turn our focus to Job creation, contraction, and net job creation across different firm sizes, locations, sectors, and ownership structures. In this episode, we will conceptualize the concepts related to employment share and then explore net job creation based on the size of the firms. Let’s recap what we observed in the previous episodes, as shown in Figure 1 below, the employment share in 2011 was confined only to small and medium enterprises. In 2022, the employment share expanded to large firms as well, with 3%.
Figure 1 Employment Share:
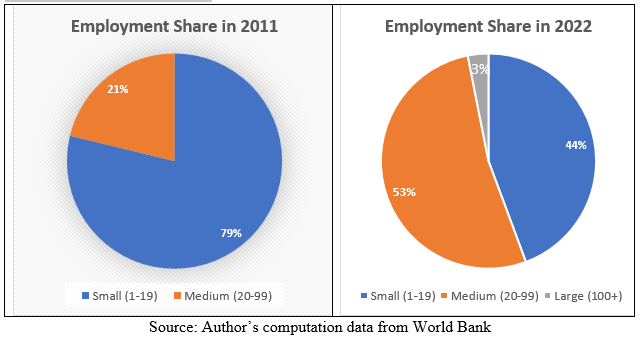
Source: Author’s computation data from World Bank
Now, we will explore the percentage of firms that added jobs, those that reduced their workforce, and the broader implications of these shifts. This episode delves into the story of Job Creation, Job Contraction, and Net Employment Change in Iraq based on the firm size.
The labour market is the heartbeat of any economy, and understanding how jobs are created and lost helps us to see the bigger picture of economic growth. The World Bank’s enterprise survey (2011 & 2022) provides a revealing snapshot of employment dynamics in Iraq’s Private Sector. There are four indicators.
Employment Share:
This indicator tells us how jobs are distributed among different types of businesses. Are small firms the biggest employers or do large corporations dominate? This measure helps us to understand where most jobs are concentrated. (Haltiwanger et. Al 2013; Aga et.al 2015).
Employment Expansion (Job Creation):
This measures the growth in the total number of permanent full-time jobs. It only includes businesses that have increased their workforce, showing which sectors and companies are driving the employment growth (Haltiwanger et al. 2013; Aga et.al 2015).
Employment Contraction (Job Contraction):
Just as some firms grow, others shrink. This indicator tracks how much employment has declined, focusing on businesses that have cut jobs. Understanding contractions helps pinpoint economic slowdowns and struggling industries (Haltiwanger et al. Al 2013; Aga et.al 2015).
Net Employment Change (Net Job Creation):
The most significant metric, this calculates the difference between job creation and job contraction. A positive net change means the economy is adding jobs overall, while a negative number signals a net loss of employment (Haltiwanger et. Al 2013; Aga et.al 2015).
The following Table 1 reveals a complete transformation in employment trends.
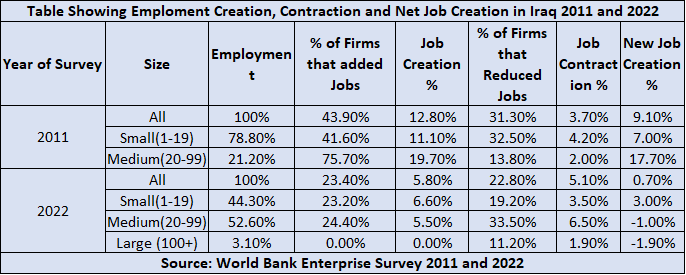
The World Bank (2011 & 2022) data reveals several key trends that show a complex picture of Iraq’s labor market over a decade. First, the structure of employment has shifted significantly, in 2011, small firms dominated, accounting for nearly (78.8%) of employment. By 2022, their share had dropped to 44.3%, while medium-sized firms rose to 52.6%, and large firms emerged as a small but notable presence of 3%. This suggests a maturing economy, with businesses scaling up and moving beyond the informal, small-scale operations that once prevailed.
Figure 2: Job Creation in Iraq
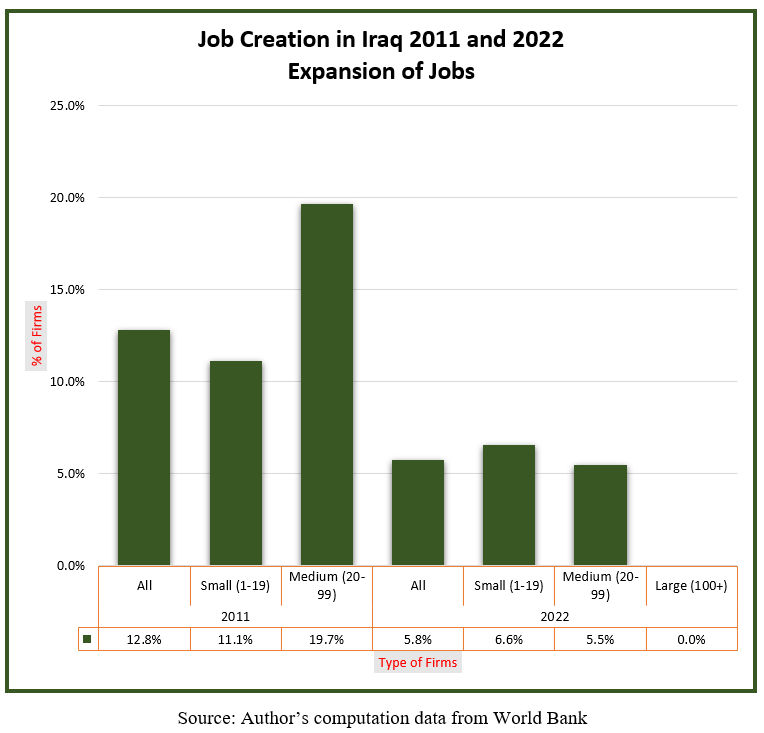
Source: Author’s computation data from World Bank
However, the structural shift has not translated into robust job creation. In 2011, (43.9%) of firms were adding jobs, contributing to a (12.8%) job creation rate. By 2022, only 23% (Table 1) of firms were expanding their workforce, and the job creation rate had fallen to (5.8%). Medium-sized firms, now the largest employers, contribute 53% with 24.4% of firms adding new jobs, but this is not sufficient to counterbalance the overall decline. Figure 2 shows the job creation in Iraq in 2011 and 2022. It can be observed that large firms did not contribute to any expansion.
Figure 3: Job Contraction in Iraq
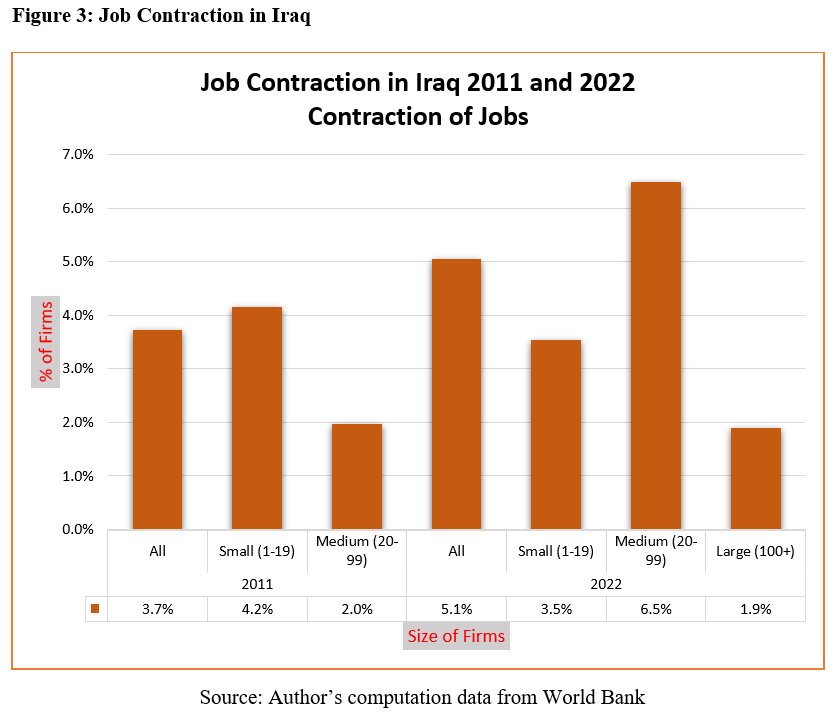
Source: Author’s computation data from World Bank
At the same time, job contraction or losses have increased. In 2011, (31%), (Table 1) of firms reduced their workforce, leading to a 3.7% job contraction rate. By 2022, the contraction rate had risen to 5.1% with 22.8% net job loss from overall firms. The large firms’ contraction rate is 1.9%, whereas the Medium firms accounted for 6.5% as shown in Figure 3.
Let’s now see the net job creation. Figure 4 depicts the net change or net job creation in Iraq in 2011 and 2022.
Figure 4: Net Job Creation in Iraq
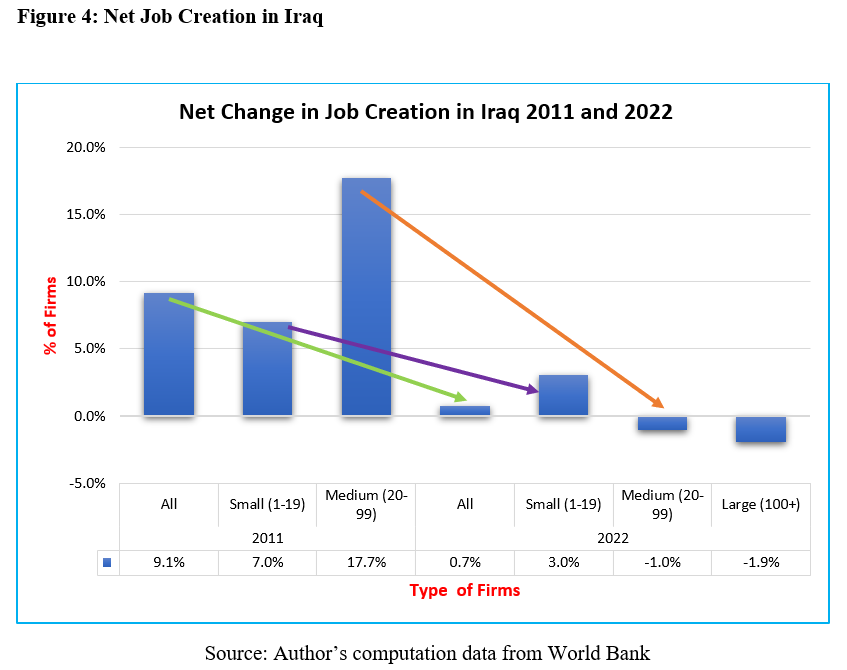
Source: Author’s computation data from World Bank
The most remarkable trend is the sharp decline in net job creation. In 2011, the economy added jobs at a rate of 9.1%, driven largely by small firms. By 2022, the net job creation had collapsed to just (0.7%) with medium and large firms showing negative contributions. Overall job creation has fallen from 9.1% to 0.7%. Small businesses’ job creation reduced from 7% to 3%. Medium size businesses reduced from 17.7% to a negative of (-1.0%). This suggests significant challenges in sustaining employment growth.
As we analyze employment dynamics across firms in Iraq, it becomes clear that job creation and contraction vary significantly by the size of the firm, sector, firm characteristics, and managerial factors. |In the next episode, we will delve deeper into sector-wise employment trends, comparing manufacturing and services, while exploring the role of managerial gender and ownership structure in shaping job opportunities. Stay tuned for more insights into the evolving landscape of Iraq’s private-sector employment.
Acknowledgments:
The author expresses her sincere thanks to the Enterprise Analysis Unit of the Development Economics Global Indicators Department of the World Bank for the data.
References:
Aga, Gemechu; Francis, David C.; Rodriguez Meza, Jorge. 2015. SMEs, Age, and Jobs: A Review of the Literature, Metrics, and Evidence. Policy Research Working Paper; No. 7493. © World Bank, Washington, DC. http://hdl.handle.net/10986/23455 License: CC BY 3.0 IGO
Haltiwanger, John, Ron S. Jarmin, Javier Miranda; Who Creates Jobs? Small versus Large versus Young. The Review of Economics and Statistics 2013; 95 (2): 347–361. doi: https://doi.org/10.1162/REST_a_00288
World Bank. (2011). Enterprise Surveys, retrieved from www.enterprisesurveys.org
World Bank. (2022). Enterprise Surveys, retrieved from www.enterprisesurveys.org