


INTRODUCTION
The replacement of collapsed and abandoned old neighborhoods with a revitalized district in a matter of life quality is being discussed through underlined subject along with suggestive solutions to each problem analyzed and pointed, in addition, the advantages of regeneration of old urban areas have been unfolded in this research in order to encourage the startup of the regeneration process. Later on, the publishing of the research will show its openness to encouraging and support to start the revitalizing process. When Sustainable regeneration is the objective, its achievement will be sustainable development which is directly related to the physical, social, economic, and environmental objectives of the community. Even though the result can be seen with time but the benefits and advantages can continue for generations. Urban regeneration study not only aims in revitalizing the urban area but also contributes to stopping the place from more deterioration. The research subject is addressed to the current situation of urban areas that need immediate response to regeneration in order to save one of the oldest areas in Erbil city and data collection is the root support for urban regeneration. Weak and strong points have been explained by monitoring the condition of the streets, buildings, and facilities of the district. The main point of this article is to indicate the location state of past and present and collect data that exist currently in the location along with historical background data of the location by then being analyzed, in addition, connecting the analysis and urban regeneration ideas with future researches.
4. CASE STUDY: KHANAQA AS A HISTORICAL NEIGHBORHOOD OF ERBIL CITY
The process of data collection started by getting the general map of the area from the municipality and then by site observation process all the buildings, streets, and minor roads were checked in terms of land use, areas, building heights, building orientation, building condition, finishing materials of façades, built-up areas, number of floors, street widths, and intersections (nodes). Moreover, the traffic density of pedestrians and vehicles in the site was measured by counting the number of vehicles and people passing through the corners of the main intersections (nodes) of the site during rush hours of the day.
4.1 Land Uses of Khanaqa Street
Various types of land use in the area are presented (figure 1) including residential, preserved, commercial, mixed-use, open space, social, streets, grave yard, and governmental lands within a total of 24-hectare area. The chart illustrates a high percentage of land use in streets 26% and commercial 22.6% parts and the lowest percentage of 1.3% in the residential part.
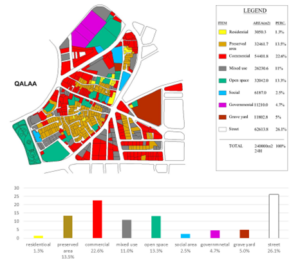
Figure 1: Land use map of Khanaqa neighborhood.
The map in (figure 2) determines two types of land, residential land, and preserved residential lands. The chart shows a high percentage of preserved lands about 91.4% in the area compared to the residential lands which still there are inhabitants inside the buildings.
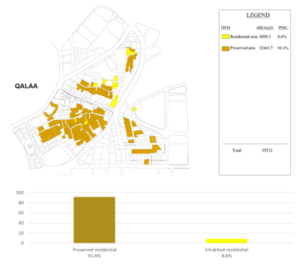
Figure 2: Residential land use map of Khanaqa neighborhood.
The commercial lands include shops, mixed uses, storage, hotels, and restaurants as shown in (figure 3) and the chart point out the highest percentage of lands in which they are shops and mixed uses about 63.9% and 33.8%.
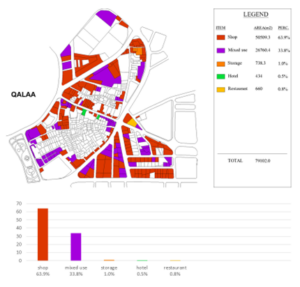
Figure 3: Commercial land use map of Khanaqa neighborhood.
The mixed-use buildings (figure 4) have different functions such as shop & storage, residential & storage, residential & shop, and hotel & shop. The mixed-use between shop & storage shows maximum level among other mixed-use buildings with a 78% percentage.
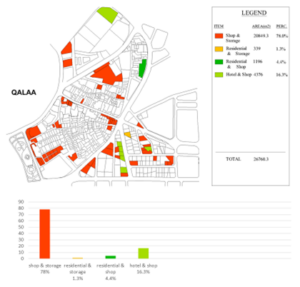
Figure 4: Functions of mixed-use buildings map of Khanaqa neighborhood.
Orientation is important to maintain comfortability in living spaces for inhabitants throughout the year. Erbil city has a hot-dry climate in summer, considering the high temperature that starts from the month of June and continues to September (Weatherspark, 2022), it’s better to face longer facades of buildings to the South and North in this way the buildings receive solar exposure in a minimum level (Ayeb, 2016). Figure 5 indicates the orientation of each land in the area, also the chart shows that buildings are mostly oriented to North-East 24.2% and South-West 21.9% percent.
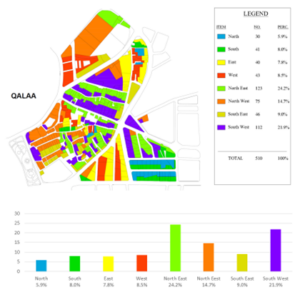
Figure 5: Building orientation map of Khanaqa neighborhood.
The physical situation of buildings in (figure 6), defines the building condition according to the statutes like bad, medium, and good conditions. Bad-conditioned buildings are partially ruined, physically in a weak condition that cannot be used. While medium conditioned once are physically in a weak condition yet can be used with little maintenance. But well-conditioned buildings are physically in a good condition that can be used for many years. Also, the chart shows that there is a high percentage of bad 43% and medium 39.8% conditioned buildings.
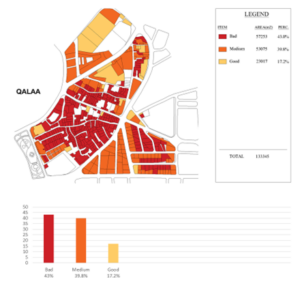
Figure 6: Building condition map of Khanaqa neighborhood.
Various types of materials are used in the buildings of the Khanaqa neighborhood which contain concrete, brick, alucobond, glass, concrete block, human stone, alabaster, ceramic, and corrugate. The chart in (figure 7) illustrates a high percentage in the usage of concrete 46.3% and brick 40.8% materials in the area. They used bricks materials from decades ago but still. They remained as the main materials of the buildings.
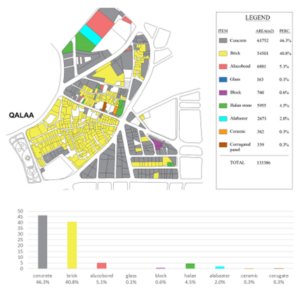
Figure 7: Building material map of Khanaqa neighborhood.
The built-up area was calculated for each building in the neighborhood and percentages according to the average built-up area. The chart in (figure 8) shows a minimum percentage of 0.77% from the areas between 1-49 sqm, and a maximum percentage of 17.43% from the areas between 100-199 sqm.
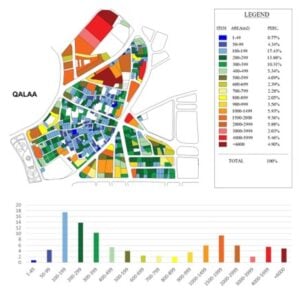
Figure 8: Built up area map of Khanaqa neighborhood.
The building heights start from 1 story to 6 stories in the Khanaqa neighborhood with different percentages that are shown in (figure 9), and the chart illustrates a high percentage of 61.4% in one-story buildings and a low percentage of 1.1% in five stories building in the area.
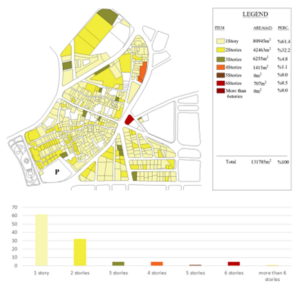
Figure 9: Building heights map of Khanaqa neighborhood.
4.2 Streets in Khanaqa Neighborhood
The (figure 10) shows dead-end streets that are defined with red color and (figure 11) shows dead spaces which are defined with black color. Both figures indicate waist accumulation through determined spaces by the users of the area.
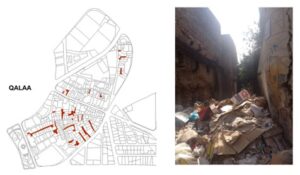
Figure 10: Dead end streets map of Khanaqa neighborhood.
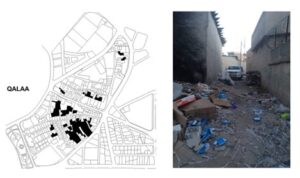
Figure 11: Dead spaces map of Khanaqa neighborhood.
The area owns streets with different width that starts from 3 meters to 21 meters. Figure 12 illustrates a range of street widths with their area and percentage, at the same time the neighborhood has the highest percentage in the street’s width between (6-8.9m) and the lowest percentage in the street’s width between (3-5.9m).
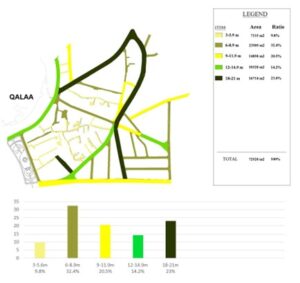
Figure 12: Street width map of Khanaqa neighborhood.
The streets in Khanaqah are divided into two types of functions whether they are residential or commercial roads recently. The chart shows that most of the streets become commercial streets in the neighborhood with a percentage of 86.6% which is higher than the residential streets with 13.4%. Also, the map in (figure 13) determines that wider streets are the one that shows commercial activities and functions.
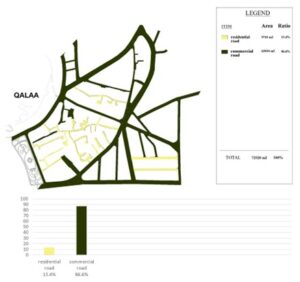
Figure 13: Function of street map of Khanaqa neighborhood.
The detailed top view and sections of the determined intersections are shown in (figure 14 and 15) The drawn sections of the first and second intersection in the figures illustrates vehicle and pedestrian movements, street width, also various setbacks, and building heights in different sections for instants in the (figure 14) the building heights in section C is much higher in section D. also the sections A and B show a wider street width with more street lane than the sections C and D.
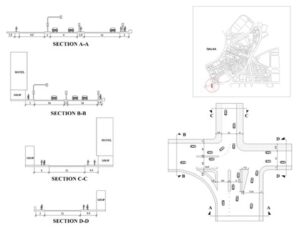
Figure 14: Street intersection details map1 of Khanaqa neighborhood.
The second intersection in (figure 15) illustrates a star shape in the top view. The streets of the intersection show approximately the same building heights in sections A, B, C, and D, but there is a wide difference when they are compared to section E. Section C and D show the same street width, while sections A and B illustrate different setback, pavement and street width.
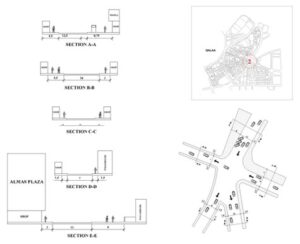
Figure 15: Street intersection details map2 of Khanaqa neighborhood.
4.3 Traffic in Khanaqa Neighborhood
During the observation works, two different intersections were chosen in the (figure 16) to track the crowding level of streets by vehicles and two points to track the crowding level of streets by pedestrians in the (figure 17) at various times of the day.
The first intersection in (figure 16) illustrates a maximum number of vehicles in street B about 2052 vehicles, and the minimum number of 264 vehicles in street A from 8:30 am to 9:30 am. While the number of vehicles changes in the same intersection with the change in tracking time, it shows a maximum number of vehicles about 765 vehicles in street D and a minimum number of about 167 vehicles in street E from 4:30 pm to 5:30 pm. The second intersection in (figure 16) displays a maximum number of vehicles about 729 cars in street D and the minimum number of vehicles about 143 cars in street E from 8:30 am to 9:30 am and it shows a little change in the number of vehicles with the change in tracking time from 4:30 pm to 5:30 pm, it displays the maximum number of vehicles in street D about 765 cars and the minimum number of vehicles in street E about 167 cars.
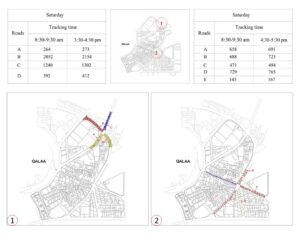
Figure 16: Car crowded joints map of Khanaqa neighborhood.
The first point in the (figure 17) shows the maximum number of pedestrians in the observed street, at the first point is 2368 people passing by the street from 10:00 am to 11:00am and the number changed to 2604 people from 4:30 pm to 5:30 pm. The second point of (figure 17) shows the maximum number of pedestrians about 1708 in street A and the minimum number of pedestrians about 312 in street B from 8:30 am to 9:30 am, while from 3:30 pm to 4:30 pm the numbers changed to 1879 person in the street A and 344 persons in street B.
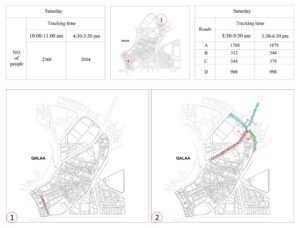
Figure 17: Pedestrian crowded joints map of Khanaqa neighborhood.
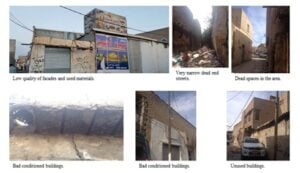
Figure 18: Shows the weak points of Khanaqa neighborhood.
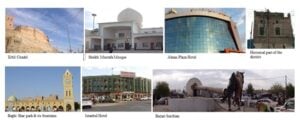
Figure 19: Shows the strength points of Khanaqa neighborhood.
| Weaknesses | Strengths |
| Low quality of facades and finishing materials. | The location of the site as it is near to Erbil’s ancient citadel and main Bazar. |
| Narrow dead-end spaces which became waste containers. | Heritage and cultural values of the site. |
| Visually and structurally bad conditioned buildings. | The site contains the main open plaza of the city (Bakhi Shar Park). |
| Abandoned (unused) buildings. |
Figure 20: Weaknesses and Strengths of Khanaqa neighborhood.
Read full article from here: https://dergipark.org.tr/en/pub/neujfa/issue/72995/1149816#article-authors-list
Note: The article is published on the website of Dergipark by Shaymaa Jalil from interior design department and Carol Kamil from architecture department staff of Tishk International University.